Parameters and it's use cases
- Vani Agarwal
- Jan 26, 2022
- 4 min read

Hi all! Well, after a very long time (again :p) I decided to write a blog on some use cases of parameters which I came across while working and which I would like to share with all of you!
I have always found parameters extremely powerful. The amount and kind of stuff that can be achieved by using them is vast and I'm sure I haven't explored even half of it yet, but definitely on the path xD
The use cases which I'll be exploring today are:
1. Showing the selected values from one chart as headers in another and blank if nothing is selected.
2. Showing values and dimensions in a chart only when one row is selected in another and blank if user selects more than two rows using ctrl + select.
CASE 1: Showing the selected values from one chart as headers in another and blank if nothing is selected.
Adding selected field values as headers without using parameters is extremely simple. Double clicking on headers and inserting the field from which values are coming would have done the job in few seconds but the problem there is that when nothing is selected, the header shows 'None' instead of becoming blank.
My use case was very specific, which was to make the header completely blank when none of the shipping modes are selected and to also show nothing in the place of map.
To do so, there are few simple steps to follow.
Step 1 - Creating a parameter.
I simple created an empty string parameter which will act as a placeholder for selected ship modes for my map header.

Step 2 - Adding the parameter to the header of map view
To do this, I'll double click on my sheet header > click on insert option > choose parameter map header.

Step 3 - Adding a parameter dashboard action
Right now our parameter is an empty string. To add the selected ship mode names to it, we need to add a parameter action from the shipping mode sheet to the map header parameter.

I have set value to just a blank space when we clear the selected, i.e., when nothing is selected. Aggregation type has been set to concatenate so that multiple fields can be seen in the header when the user selects more than one using ctrl + select.
We have already discussed how to add headers and make them blank when nothing is selected. Now, to make the chart area of map go blank when nothing is selected, we just need to add a filter action.
Step 4 - Adding a dashboard filter action
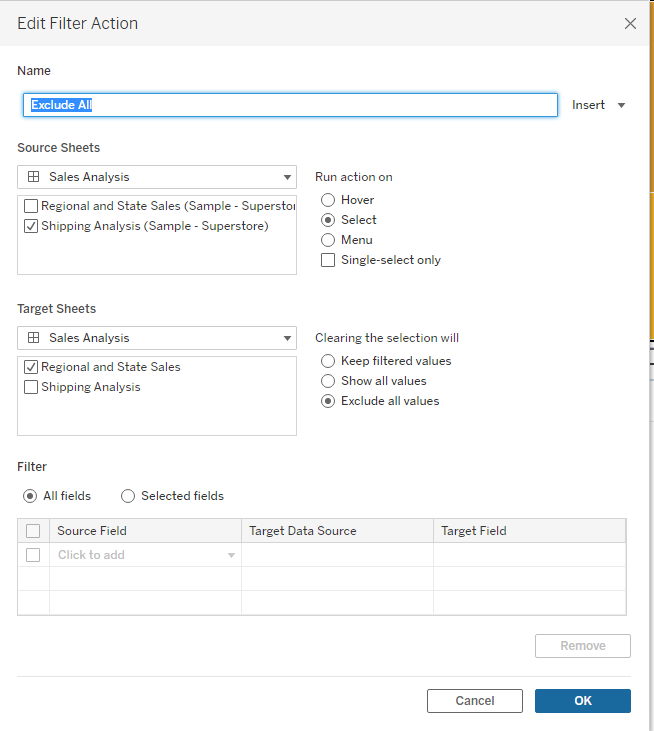
To do so, we just need to select the sheet where we are making selections (source sheet) and the sheet on which the exclude action needs to run (target sheet), the method of selection (which is select in my case) and what should happen when we clear the selection. Since I want my map to show nothing, I'll choose exclude all. This action will filter out everything in the view when no ship mode is selected.
Case 2: Showing values and dimensions in a chart only when one row is selected in another and blank if user selects more than two rows using ctrl + select.
I recently was asked to create a dashboard with multiple sheets where the user can filter one sheet using selections from another. But there was a very specific ask that the second sheet go completely blank if the user selects more than one value in the 1st sheet.
To do this, I used a parameter, calculated fields and parameter actions.
Step 1 - Create an empty string parameter
I created an empty string parameter just like we did in case 1 to hold my ship mode values. I did this because I want to make a field which will carry all my ship mode values which are selected in the first sheet and concatenate them.

Step 2- Create calculated fields
Now I'll make calculated fields to replace all my dimensions and measures in the view as per some condition.
I have used Region, State and Sales to create the bar chart. So we will need to create 3 fields.
region - IF [Ship Mode]=[Ship Mode Placeholder] THEN [Region] END
state - IF [Ship Mode]=[Ship Mode Placeholder] THEN [State] END
sales - IF min([Ship Mode])=[Ship Mode Placeholder] THEN SUM([Sales]) END
The above calculated fields are checking if the selected ship mode is equal to itself or not. If it's equal to itself, that means that only one ship mode has been selected, and if that's true then I want my dimensions and measures. But if multiple values are selected, the the parameter will have all of them concatenated as per the dashboard action and my condition will become false.
*Now, replace the actual dimensions and measures with the above created ones.
Step 3 - Creating a dashboard parameter action
The last step is to add a parameter action to add and concatenate the ship mode values.

Now, when you select more than one ship mode, the 2nd chart will go completely blank.
Thank you for reading the blog. I hope it was helpful.
As always, do let me know if there are better or alternate ways to achieve the above results and I would be happy to discuss and doubts or feedbacks.


Comments