How to add dimensions after measures without converting measures into discrete values
- Vani Agarwal
- Apr 16, 2022
- 2 min read
Hi guys! I recently has a requirement where the client wanted to show several measures against a dimension and then have one more dimension at the end after the measures.
Now, tableau by default arranges all the dimensions on the left hand side before the measures and this cannot be rearranged.
A simple way to achieve this would have been converting all the measures into discrete values and then adding everything in whatever order the client wanted.
But this approach wasn't possible because we also wanted to show the grand total of all measures and this is not allowed when values are discrete.
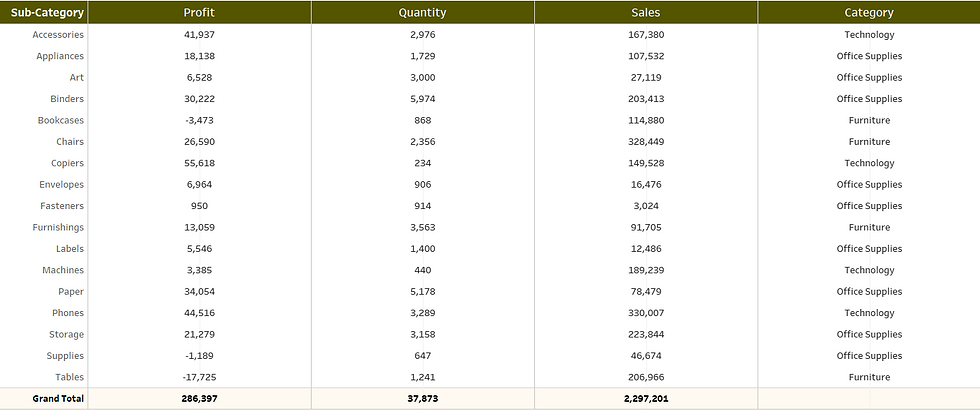
Below is a snapshot of what was required.

Before I go into the process I want you all to note that this method is only possible if we want only one dimension at the end after our measures. We will discuss more about the why below.
Step 1 : Adding empty placeholders.
Since all measures come after a dimension, I need to make sure that we have measure placeholders after our main dimension, i.e. Sub-Category.
Adding empty placeholders also gives us the option of separate placeholders under the marks card and the flexibility to format them independently.
I have added min(1) as a placeholder. It can be any aggregate measure.

Step 2: Adding measures and dimensions in the empty placeholders
After we have added our placeholders, we can add our measure fields and dimensions in each of them respectively.
I added my measure values on the first min(1) and the dimension on the second min(1).


It's important to note here that this is all possible only if we have 1 dimension that is to be displayed after our required measures. Having multiple will add that number of columns under each measure name.
Step 3: Make the placeholders dual axis
Make sure to make the placeholders dual axis or else each one of them will have multiple columns as per the number of dimensions. Hence, we can only add one dimension after our measures. Having more than one will add multiple columns which can't be hidden even after doing dual axis.
Below image is how it will look without dual axis

Step 4 : Make the marks cards 'Text' from automatic
Doing this will remove the thin bar charts and make the chart look like a table.
Thanks for reading. Feel free to reach out to me in case there's any doubt or suggestions.


Comments